|
|
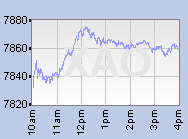
| Indices | | XAO | 8,578 | -21.60 | | XDJ | 3,988 | -14.00 | | XEJ | 8,876 | -32.10 | | XFJ | 8,888 | -23.20 | | XFL | 8,202 | -16.60 | | XHJ | 46,068 | 4.30 | | XIJ | 2,781 | -12.70 | | XJO | 8,329 | -19.90 | | XKO | 8,262 | -21.80 | | XMD | 10,299 | -27.70 | | XMJ | 16,223 | 10.90 | | XNJ | 7,730 | -72.80 | | XPJ | 1,768 | -3.70 | | XSJ | 11,735 | -96.00 | | XSO | 3,119 | -22.10 | | XTJ | 1,655 | -2.30 | | XTL | 4,715 | -6.30 | | XTO | 7,014 | -14.80 | | XUJ | 9,102 | 60.70 | | XXJ | 9,913 | -25.80 |
|
|


| |

|
|
 |
|
Welcome to WebCharts
|
|
WebCharts offers its members the ultimate in live ASX share, Options and Warrants data. We will provide you with accurate, reliable and timely data on our live data plan. We also offer you a 20 minute delayed plan.
|
|
|
|

|
| All Ordinaries |
 |
 |
| top ASX rises |
top ASX falls |
| TX3 |
0.002 |
100% |
NRZ |
0.001 |
50% |
| EAT |
0.003 |
50% |
RAN |
0.003 |
50% |
| MSI |
0.006 |
50% |
SFG |
0.001 |
50% |
| AAU |
0.004 |
33% |
EDE |
0.001 |
50% |
| MRQ |
0.004 |
33% |
NTD |
0.170 |
35% |
 |
| global indices |
| FTSE 100 |
8251.0 |
 |
0.00% |
 |
|